Semtech 2010, San Francisco
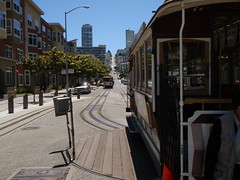 San Francisco is such a very beautiful city. The blue sky, clean streets and the cable cars. A short walk and you're on the coast, with the bridges and islands.
I've been to San Francisco before, for less than 24 hours and I only got to see the bridge from the plane window as I flew out again so it's especially nice to be here for a week.
I'm here with colleagues from Talis for SemTech 2010.
We've had some great sessions so far. I sat in on the first day of OWLED 2010 and having seen a few bio-informatics solutions using OWL this was an interesting session. First up was Michel Dumontier talking about Relational patterns in OWL and their application to OBO. Michel talked about the integration of OWL with OBO so that OWL can be generated from OBO. He talked about adding OWL definitions to the OBO flat file format as OBO's flat file format doesn't currently allow for all of the statements you want to be able to make in OWL. In summary, they've put together what looks like a macro expansion language so that short names on OBO can be expanded into the correct class definitions in OWL. This kind of ongoing integration with existing syntaxes and formats is really interesting as it opens up more options than simply replacing systems.
The session went on to talk about water spectroscopy, quantum mechanics and chemicals, all described using OWL techniques. This is heavy-weight ontology modelling and very interesting to see description logic applied and delivering real value to these datasets. You can get the full papers online linked from the OWLED 2010 Schedule.
On Monday evening we had the opening sessions for Semtech, the first being Eric A. Franzon, Semantic Universe and Brian Sletten, Bosatsu Consulting, Inc. giving a presentation entitled Semantics for the Rest of Us. Now, this started out with one of the best analogous explanations I've ever heard - so obvious once you're seen it done. Eric and Brian compared the idea of mashing up data with mashing up music, mixing tracks with appropriate tempos and pitches to create new, interesting and exciting pieces of music; such wonders as The Prodigy and Enya, or Billy Idol vs Pink. Such a wonderfully simple way to explain. The music analogy continued with Linked Data being compared with the Harmonica, "Easy to play; takes work to master". From here, though, we left the business/non-technical track and started to delve into code examples and other technical aspects of Semantic Web - a shame as it blemished what was otherwise an inspiring talk.
There was the Chairman's presentation, "What Will We Be Saying About Semantics This Year?". Having partaken of the free wine I'm afraid we ducked out for some dinner. Colibri is a little mexican restaurant near the Hilton, Union Square.
 That was Monday, and I've now spent all of Tuesday in the SemTech tutorial sessions. This morning David Wood and Bernadette of Semantic Web consultancy Zepheira did an excellent session on Linked Enterprise Data. The talk comes ahead of a soon-to-be-published book, Linked Enterprise Data which is full of case studies authored by those directly involved with real-world enterprise linked data projects. Should be a good book.
One of the things I liked most about the session was the mythbusting, this happened throughout, but Bernadette put up, and busted, three myths explicitly. These three myths apply to many aspects of the way enterprises work, but having them show up clearly from the case studies is very useful to know.
Myth: One authoritative, centralized system for data is necessary to ensure quality and proper usage.
Reality: In many cases there is no “one right way” to curate and view the data. What is right for one department can limit or block another.
Myth: If we centralize control, no one will be able to use the data in the wrong way.
Reality: If you limit users, they will find a way to take the data elsewhere --> decentralization
Myth: We can have one group who will provide reporting to meet everyone’s data analysis needs.
Reality: One group cannot keep up with all the changing ways in which people need to use data and it is very expensive. Next up I was really interested to hear Duane Degler talk on interfaces for the Semantic Web, unfortunately I misunderstood the pitch for the session and it was far more introductory than I was looking for, with a whole host of examples of interfaces and visualisations for structured data - all of which I'd seen (and studied) before.
With a conference as full as SemTech there's far more going on than you can get into, the conference is many tracks wide at times. I considered the New Business and Marketing Models with Semantics and Linked Data panel featuring Ian Davis (from Talis) alongside Scott Brinker, _ion interactive, inc., _Michael F. Uschold and Rachel Lovinger, Razorfish. It looked from Twitter to be an interesting session.
I decided instead to attend the lightning sessions, a dozen presenters in the usual strict 5 minutes each format. Here are a few of my highlights:
Could SemTech Run Entirely on Excel? Lee Feigenbaum, Cambridge Semantics Inc — Lee demonstrated how data in Microsoft Excel could be published as Linked Data using Anzo for Excel. I have to say his rapid demo was very impressive, taking a typical multi-sheet workbook, generating an ontology from it automagically and syncing the data back and forth to Anzo; he then created a simple HTML view from the data using a browser-based point-and-click tool. All in 5 minutes, just.
My colleague Leigh Dodds presented fanhu.bz in 4 minutes 50 seconds. It was great to see a warm reception for it on twitter. Fanhu.bz tries to surface existing communities around BBC programmes, giving a place to see what people are saying, and how people are feeling, about their favourite TV shows.
My final highlight would jute, presented by Sean McDonald. Jute is a network visualisation tool with some nice features allowing you to pick properties of the data and configure them as visual attributes instead of having the relationship on the graph. One example shown was a graph of US politicians in which their Democrat or Republican membership was initially shown as a relationship to each party, this makes the graph hard to read, but jute makes it possible to reconfigure that property as a color attribute on the node, changing the politicians into red and blue nodes, removing the visual complexity of the party membership. A very nice tool for viewing graphs.
Then out for dinner at Puccini and Pinetti — not cheap, but the food was very good. The wine was expensive, but very good with great recommendations from the staff.
Great day.
Comments
RT @mmmmmrob: #semtech Summary so far: http://dynamicorange.com/2010/06/22/semtech-2010-san-francisco/
This comment was originally posted on Twitter
Reading @mmmmmrob: #semtech Summary so far: http://bit.ly/cenB4o and listening to @JimmyBuffett http://bit.ly/bqIv4t ;)
This comment was originally posted on Twitter
RT @mmmmmrob: #semtech Summary so far: http://dynamicorange.com/2010/06/22/semtech-2010-san-francisco/
This comment was originally posted on Twitter